Ksniff: packet capture at pod level for k8s 🕵️♂️📦
Troubleshooting containers in Kubernetes is a recurring topic that you may face regularly. Logging and monitoring tools come in really handy here as they help you better understanding what is going on in the cluster or in the containers itself. Besides, it is possible to get valuable insights with the help of the classic kubectl commands such as kubectl describe, kubectl logs or kubectl exec.
However, in some scenarios, these tools are not enough as you may need to examine the actual incoming and outgoing traffic for the containers in a pod, for example to determine connection issues at TCP level. So, in those cases, how do we get to inspect this traffic?

The answer is simple, the exact same way that we would do it in a computer or a virtual machine, a packet sniffer. In this article we will introduce Ksniff as a Kubernetes-integrated packet sniffer, developed by Eldad Rudich.
How does it work? 💻🤔
Ksniff is shipped as a kubectl plugin that allows using tcpdump and Wireshark to capture traffic on a specific pod within a cluster. Ksniff uses kubectl to upload a tcpdump binary (packet sniffer) to the target container, and redirects the output to the Wireshark instance running in your machine.
You may be thinking right now, how would this work in containers without explicit network capabilities or non-privileged users? Well, Ksniff has specific flag (-p) for that. This approach can be also used to sniff traffic in distroless containers, where the binary cannot be executed by a shell.
By using the -p flag, Ksniff will deploy a pod in the same node where the target pod/container is placed, with access to the docker daemon. The container within this ‘auxiliar’ pod is placed in the same network namespace as the target container, and traffic can then be captured.
Wireshark 📡🦈
Wireshark is a graphic network packet analyzer which is based on pcap, an API for network packet capture. If you don’t have previous experience with Wireshark you can get plenty of information and tutorials in its documentation.
Long story short, apart from the packet capturing capabilities, Wireshark provides a graphical interface that can be used to analyze packet captures, filtering by protocol, port and a wide range of packet attributes.

In order to get Wireshark installed, you just need to get the installer for your OS in this link and follow the steps indicated by the installer itself.
Installing Ksniff ⬇️⚙️
The easiest way to install Ksniff is doing it using Krew, a plugin manager for kubectl. If you haven’t installed it yet, you can get it into your machine by executing the following commands. Make sure that git is installed.
(
set -x; cd "$(mktemp -d)" &&
curl -fsSLO "https://github.com/kubernetes-sigs/krew/releases/latest/download/krew.tar.gz" &&
tar zxvf krew.tar.gz &&
KREW=./krew-"$(uname | tr '[:upper:]' '[:lower:]')_$(uname -m | sed -e 's/x86_64/amd64/' -e 's/arm.*$/arm/')" &&
"$KREW" install krew
)
export PATH="${KREW_ROOT:-$HOME/.krew}/bin:$PATH"
Once Krew has been installed, you just need to issue the following command to get Ksniff plugin.
kubectl krew install sniff
If everything goes well, you should be able to see the following output when executing kubectl sniff.

Sniffing traffic 🕵️♂️💻
For this example I used a local Kubernetes cluster (Docker desktop), but it can be replicated in any kind of cluster, either managed or self hosted.
Let’s first deploy an application that can generate and receive traffic on the cluster. In this case we will deploy an apache web server. To keep this example as simple as possible, we will use Bitnami’s apache Helm chart. If you haven’t installed Helm yet (c’mon who is going to believe that? 😉), you can get it here. Besides, you can get an introduction to Helm if needed in this article.
helm repo add bitnami https://charts.bitnami.com/bitnami
helm install web-server bitnami/apache
By now, you should have a simple apache deployment in your cluster. In this case, it is exposed as a LoadBalancer service. Check that you can reach it by using the load balancer DNS name or IP.

Once the service has been deployed it is time to launch the listener pod using Ksniff. To do so, execute the following command. After some seconds, the pod will start up and Wireshark will be opened by Ksniff, capturing traffic in real time.
kubectl sniff <your-apache-pod-name> -p
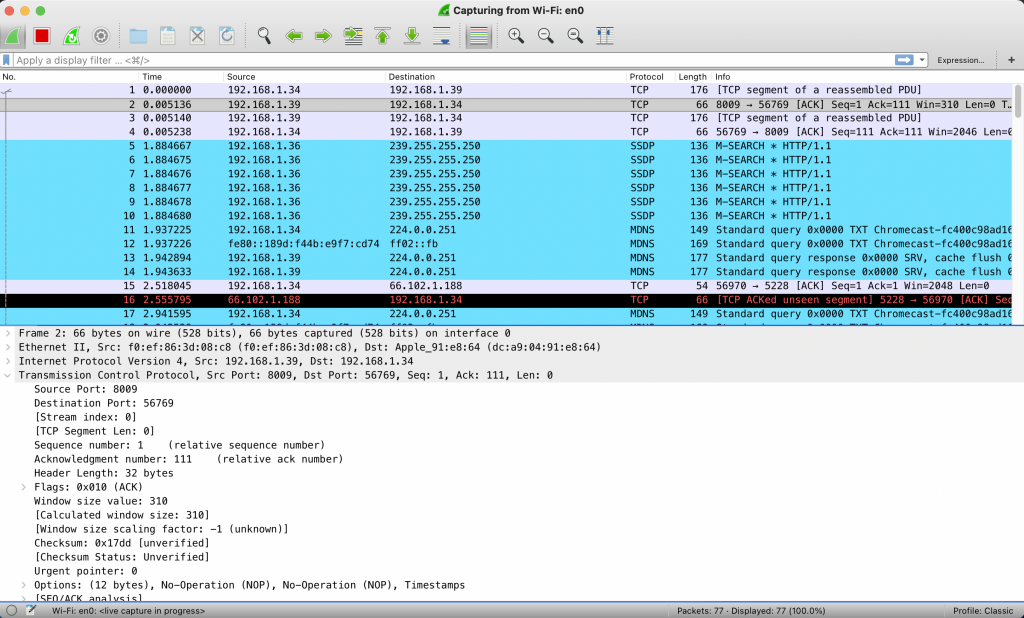
Try hitting the apache web server with your browser and check how new HTTP packets are captured by Wireshark. In the following image you can see the HTTP response containing the webpage body.

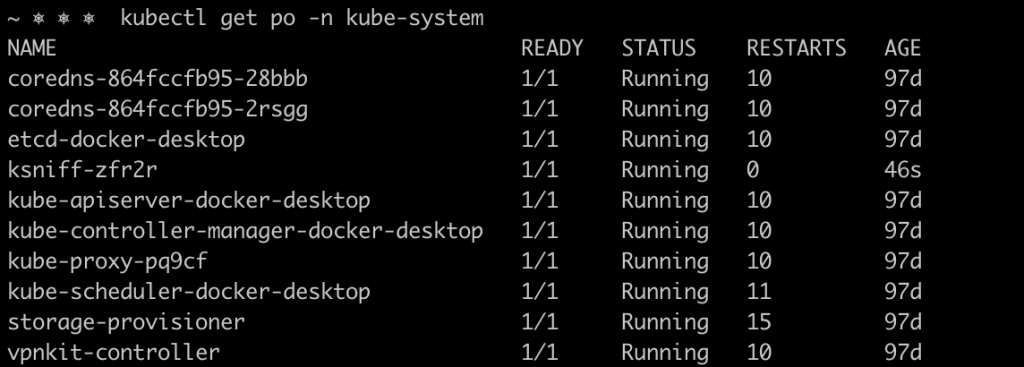
If you inspect the cluster (in a separate terminal) you will see that a ksniff pod was created in the same Kubernetes namespace where the target pod is placed.

Once you have finished this packet capture, stop it and close Wireshark. Ksniff will then eliminate the pod used to capture traffic from the target pod.
Knsniff also supports filters in the ‘tcpdump format’, so for example, you can capture all traffic directed to the port 8080 (container port for the apache server) by issuing the following command.
kubectl sniff <your-apache-pod-name> -f "port 8080" -p
Finally, let’s capture some other type of traffic. In this case, we will target DNS traffic. To do so, the target pod will be one of the CoreDNS pods, which are the ‘in-cluster’ DNS resolvers. Besides, we will redirect the capture to a pcap file rather than capturing traffc in real time with Wireshark. But don’t worry, you can later import pcap files to Wireshark to inspect all the traffic.
kubectl sniff <your-coredns-pod-name> -p -n kube-system -o dns.pcap
In this case, the Ksniff pod is deployed into the kube-system namespace, as you can see in the image below.

While capturing traffic, lets generate DNS queries from inside the cluster by executing the curl command on the apache container.
kubectl exec -it <your-apache-pod-name> -- curl kubesandclouds.com
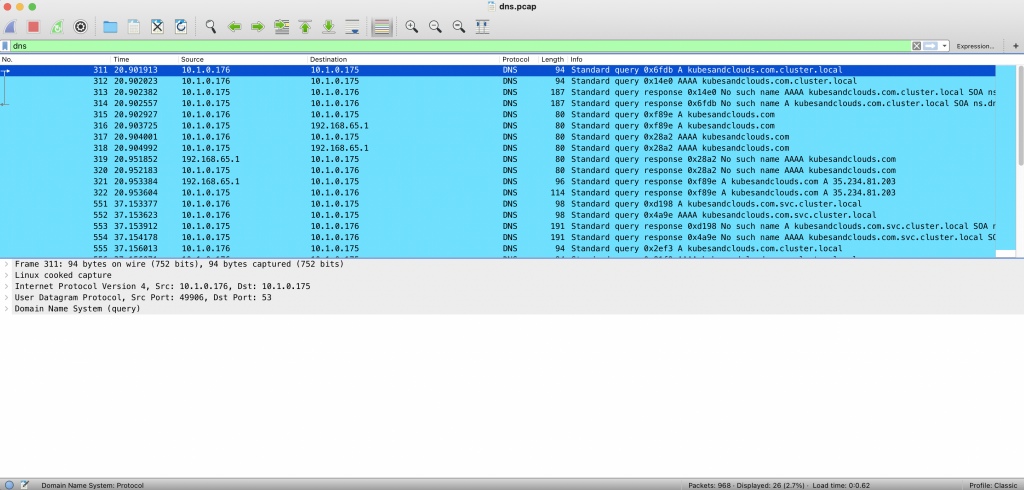
Once you’re done capturing traffic, import the capture to Wireshark. The following image shows the DNS queries and responses that were generated in the cluster in order to reach kubesandclouds.com.

TIP: You can use the -c flag in multi container pods to target a specific container for the packet capture.
Keep learning 👩💻👨💻
If you liked Ksniff, take some time to play around with it in your clusters and test the different features it offers. In my own experience, it is a pretty simple tool that brings a lot of value as a troubleshooting aid. You can get more info about it in Ksniff’s Github Repo.
.jpeg)


